Artist Spotlight: Nadieh Bremer
Constellations, Cheetahs, and Charts
Often, when I'm watching some kind of event, or reading an article about a specific person or group of people I often hear and see things like, "They're a born talent," "This person has a natural gift," "I've said it before, but they're a born prodigy!"
To me, this is hands downs one of the biggest insults you can give to a person or say about an individual who has achieved a level of mastery. That said, I don't think these things are said with negative intent.
Comments like those glaze over and negate the efforts and sacrifices an individual has made for their success: early mornings and late nights, blood and sweat and tears, probably at least one good cry (let it out, there is nothing like a good cry), and most importantly thousands of hours of effort. To acknowledge this, is to give respect.
Enter Nadieh, I swear... if you pronounce the, "eh," well I can't write what I'll do—but you better not! After doing my research and listening to her answer our questions, it is clear to me that her path to mastery has been both non-linear and time intensive. I must admit—she did all the work in this interview! I hope you as the reader admire her path to mastery as much as I do.
Without further ado...
What would you like to share about your life?
In short, I'm a graduated Astronomer, turned Data Scientist, turned Data Visualization Designer and have been moving towards data art and generative art for the past year.
I've been freelancing under Visual Cinnamon since 2017, because whoever can correctly write or pronounce my name 😅 (it's Na-di btw, di as in radio, the eh is silent).
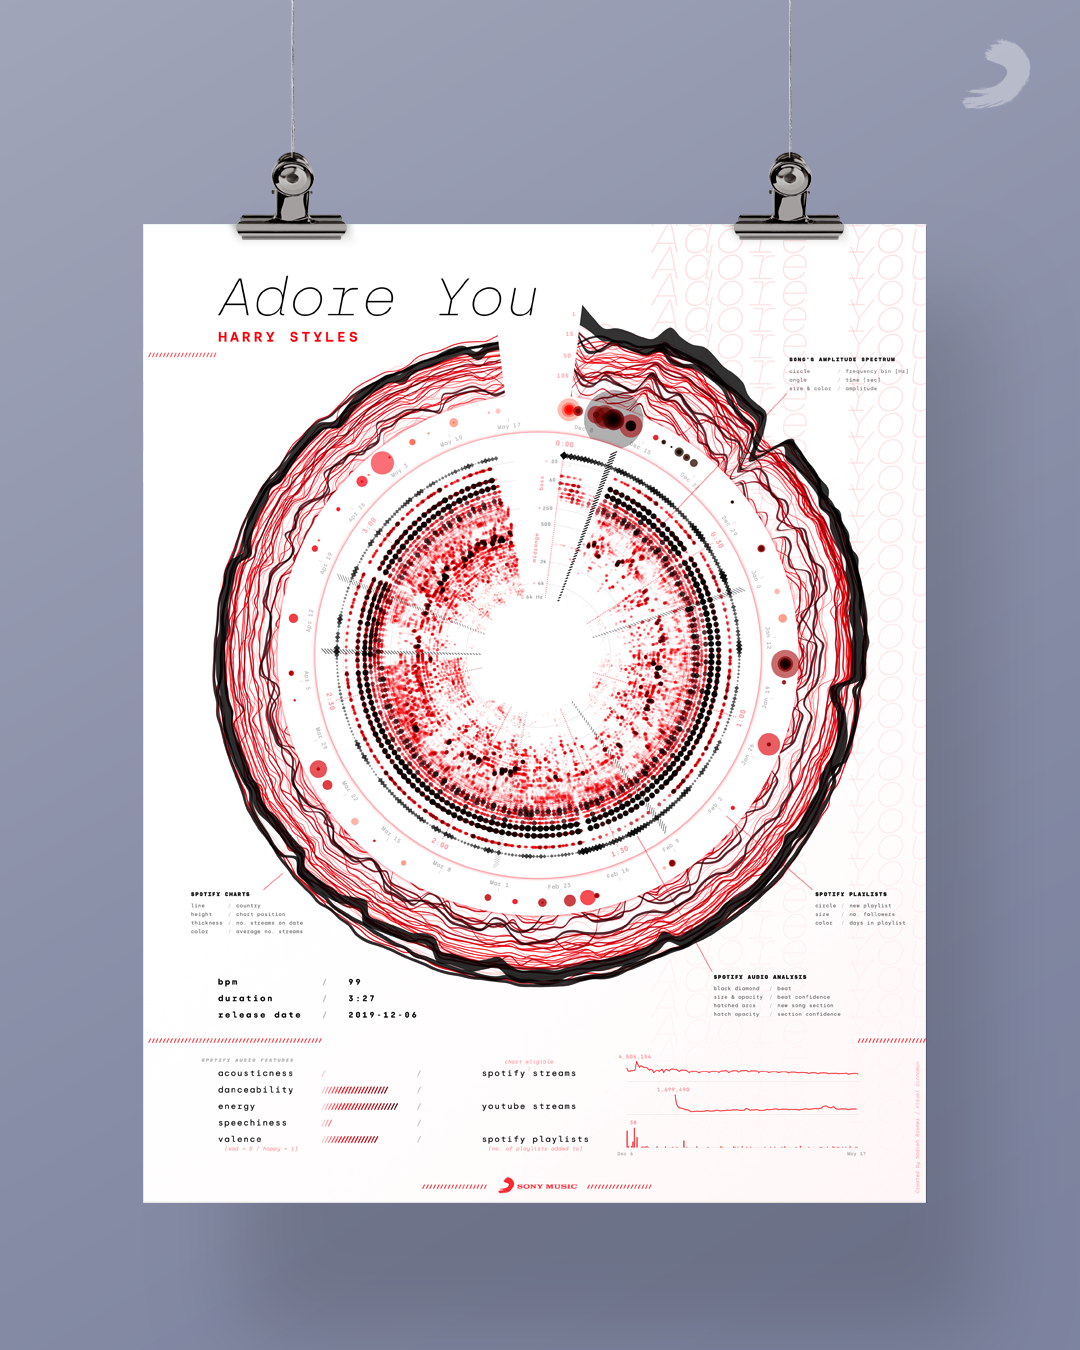
I love working with big and complex datasets, because I find they often have more than one story to tell. Especially science-related or pop culture topics draw me the most.
I live in a small town near Amsterdam in the Netherlands with my partner. I'm 1.87m (6'2") tall which has led to some interesting first reactions when I meet internet friends in real life 😂
I love cats (animals in general), fantasy books, blockbuster movies, roller skating, hexagons (they are the bestagons) and travelling the world.

What is your first memory of art?
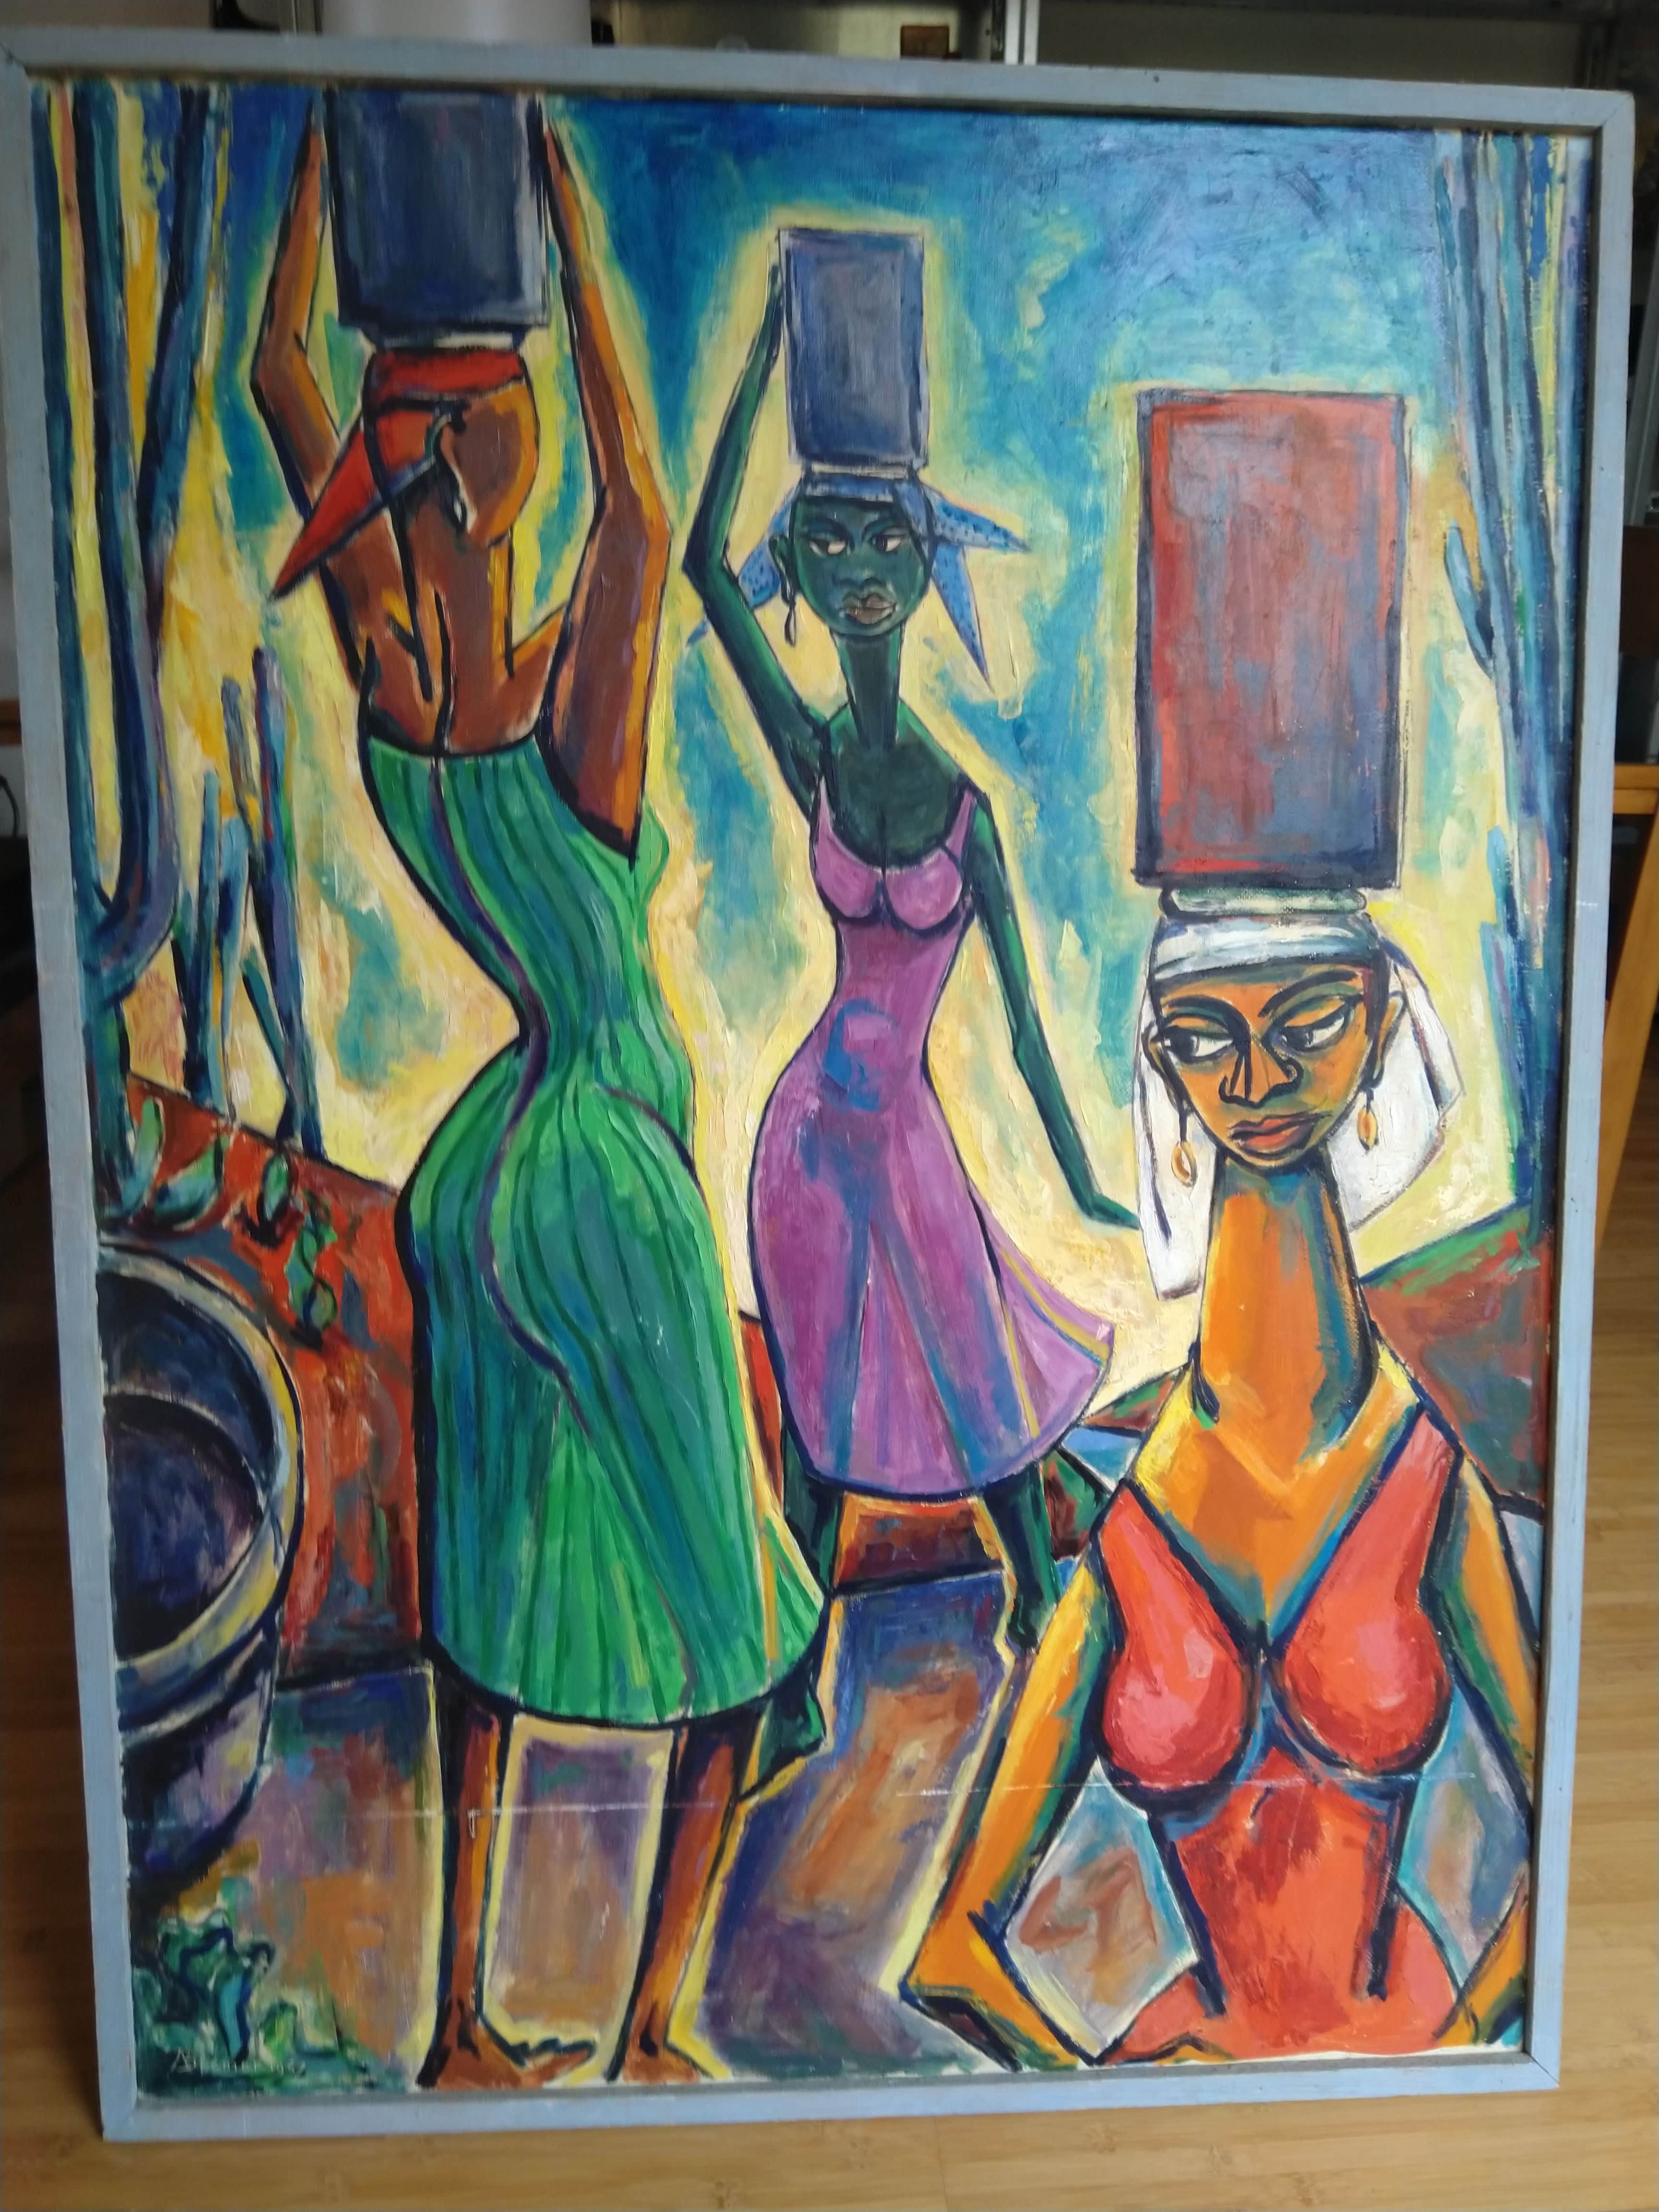
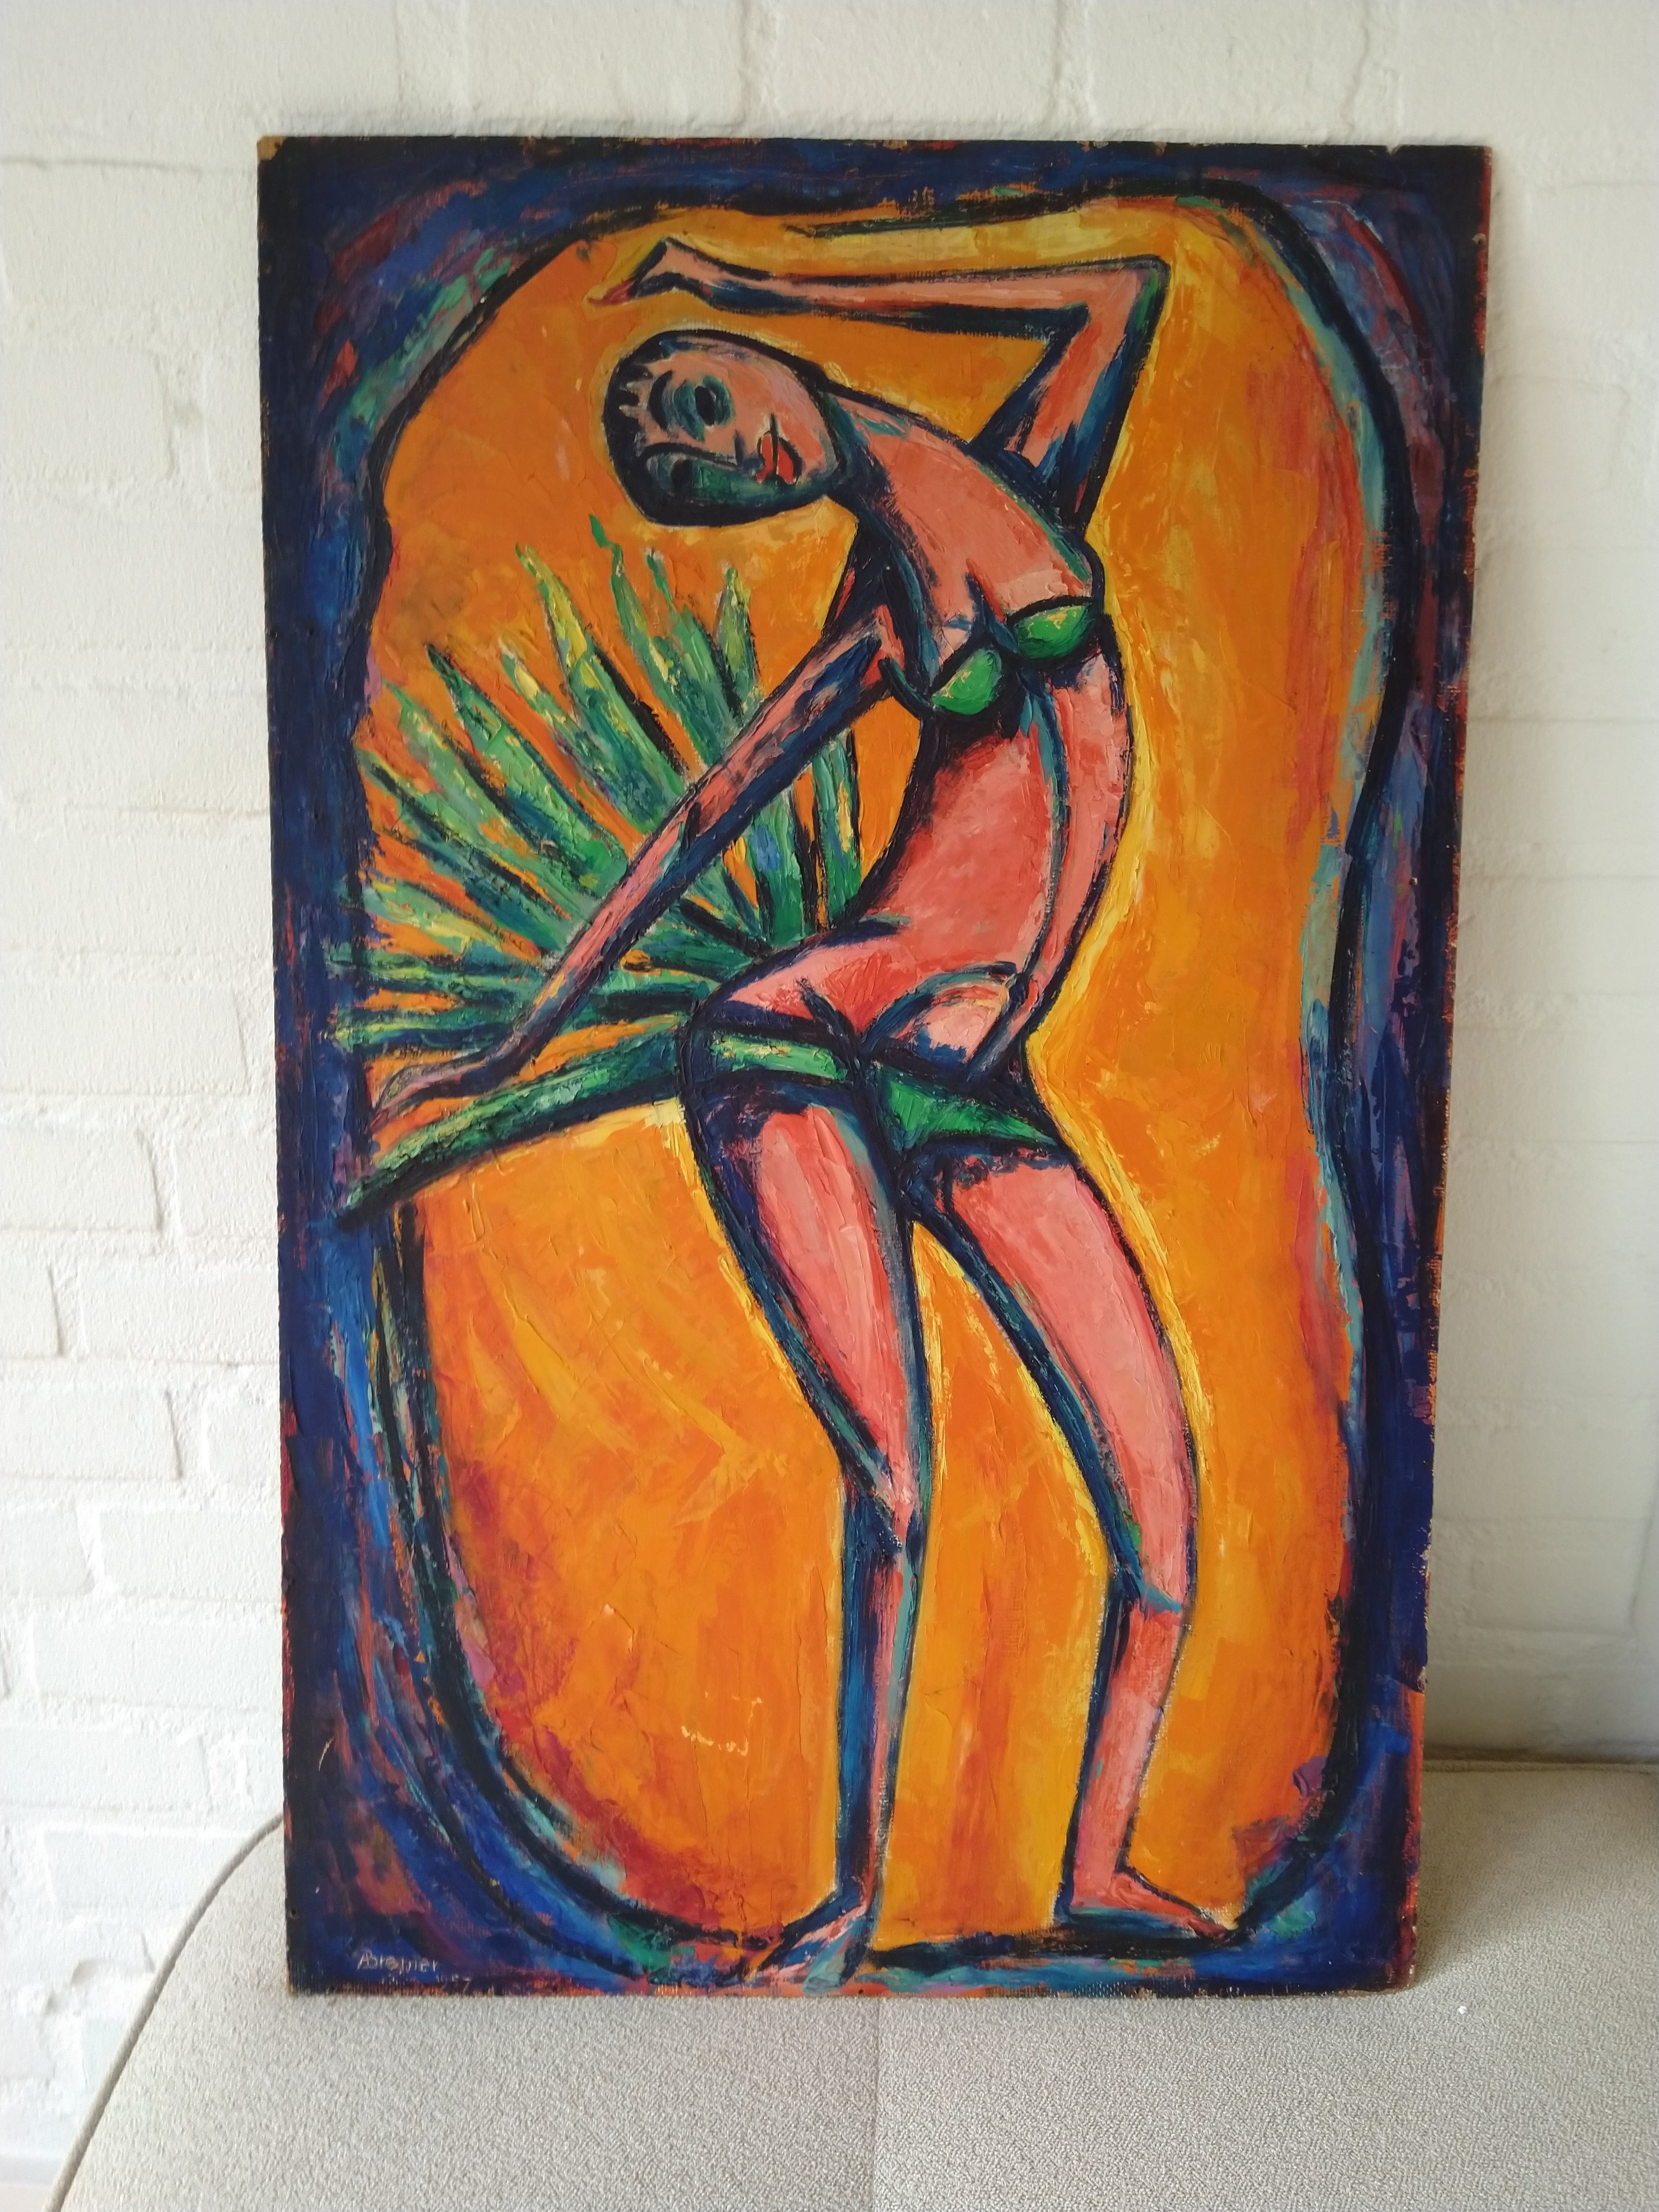
My gosh, I honestly wouldn't know for sure. But I think it must've been the paintings that my grandfather made around the 1950s and were hanging all throughout my grandmother's home (my grandfather sadly passed away at an early age and I never got to know him). He drew people mostly, with very angular lines, rough strokes, using very vibrant colors (maybe that's where my love for vibrant palettes started). I loved watching these paintings, trying to dissect it, understanding how the strokes and colors came together to the final image.
How long have you been doing art, and then creative coding?
I would say that I've always been creative, but purposely making art is quite recent. While I was studying astronomy and working as a data scientist, not making many visual things, I would pick up a new creative outlet to work on in my free time almost every week; creating our table lamps from origami, painting by melting crayons, embroidering Zelda sprites, and more.
Only once I discovered that my passion was visualizing the data that I analyzed was I able to combine the creative aspect in my work and it's become this perfect blend of math/data + creative/art for me that I'm fulfilling my creative need and don't have the need to melt crayons anymore in my weekends 😂
But I noticed that I loved it the most when I could make data visualizations that were more artful than trying to explain the data. I've therefore been trying to move more towards data and generative art for the past year. At first I tried to find clients, and I did have the chance to create two data art projects that I'm proud of. I stopped working for the first half of 2021 to study at the Fab Academy, learning how to take designs from the computer and make them with machines, to explore my creative side more. However, only once I dove into NFTs last summer did I really think that would be a way for me to truly work on data art and generative art. I grabbed that opportunity with both hands, have been working my a** off ever since, and have been loving every second of it.
Do you have any influences in the field?
I've been a fan of Matt DesLauriers for several years now. His work is just always so beautiful, so nuanced, so detailed. And then on top of that he creates tools and tutorials for the community to make it easier to "just start making generative art". I've used several of his tools over the past years, for personal and client work even.
Another person that greatly inspires me is Daniel Catt. He's a pen plotting artist (but also makes digital art and NFTs) making wonderful pen plots, combining pens, paper (or other materials) in creative ways with outputs that I can't get enough of.
How do you approach visualizing a new type of data, like an Ethereum block? What unique challenges (if any) did it present?
I always want to understand what's in the data. What variables are there? What do they mean? What distribution of values do they typically take? For example, the transactions that we have access to with BlockArt had these variables r, s and v. It took me at least an hour to find online what they stood for (not easy searching for single letter variables...) and understanding that it actually wouldn't be interesting to visualize.
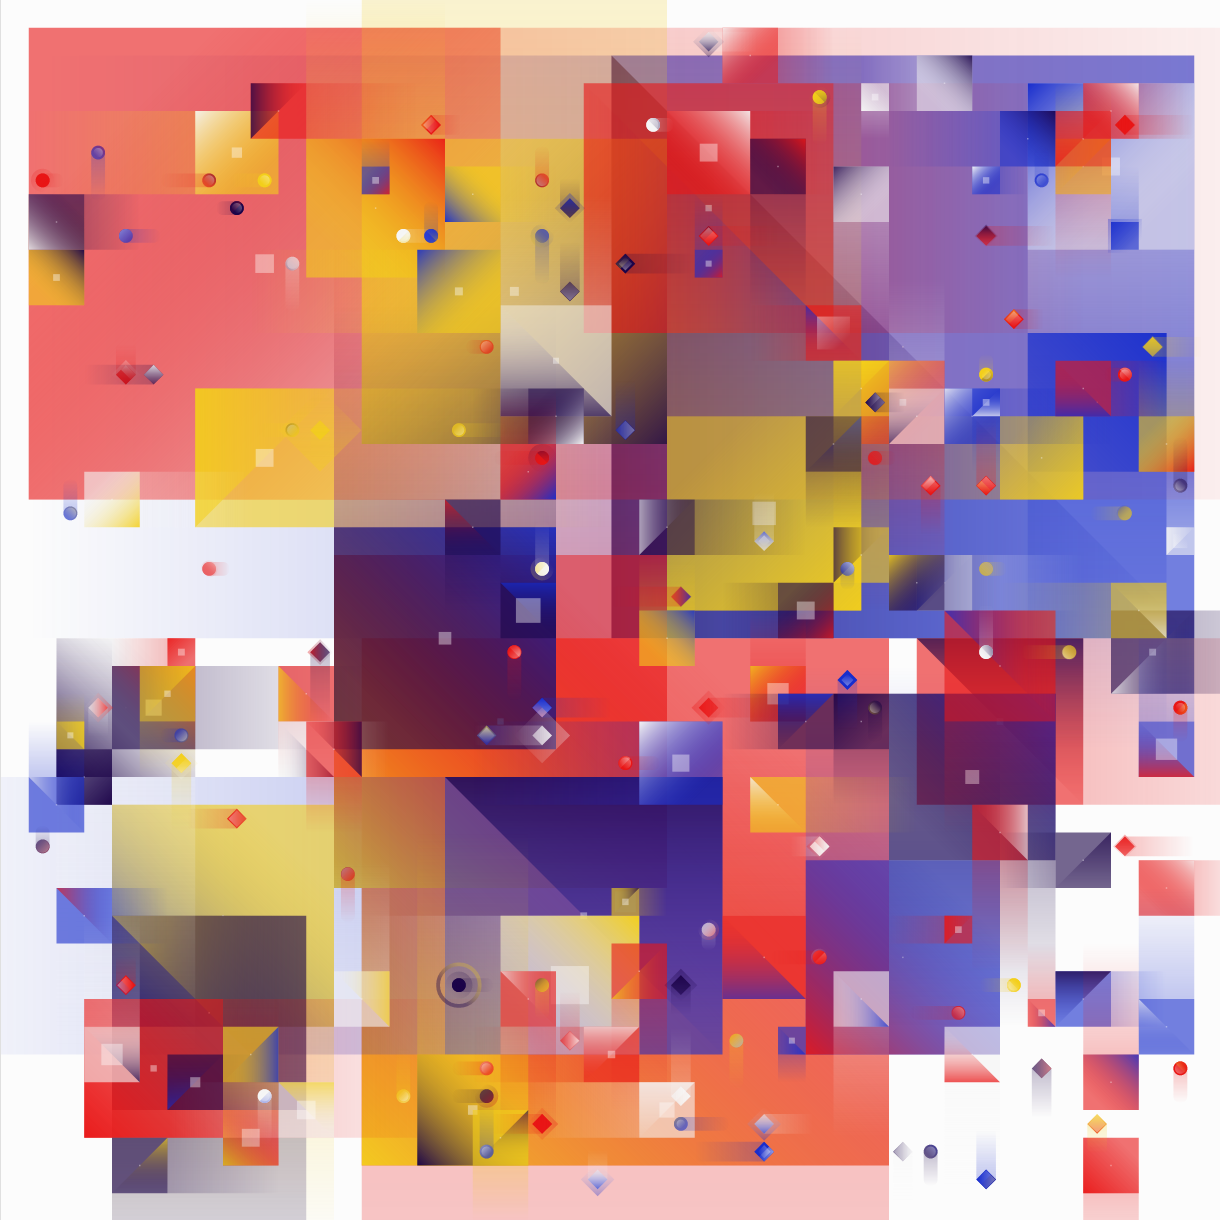
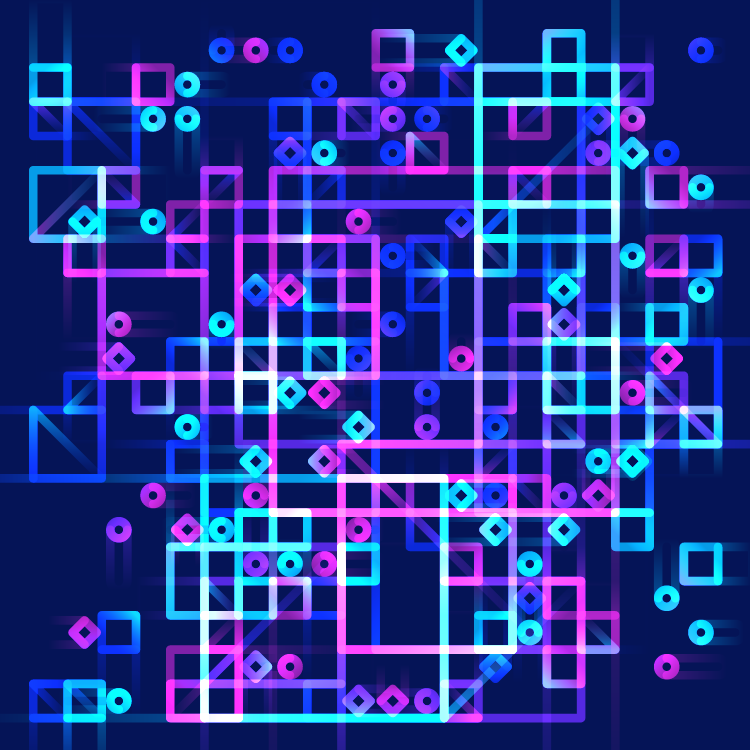
I generally try and think "What do I find interesting about this data?", "What do I want to see?" Since this was my first time working with block data I realized early that I wanted to see the transactions themselves. Straightforward, but it was clear to me that those would hold the most interesting stories; being able to see the values associated with each transaction and since I'm making NFTs I thought a cool nice-to-have aspect would be to also show which transactions were ERC-20 or ERC-721 / NFTs.
Being able to mark ERC-20 and NFTs was the biggest data challenge. Due to some technical reasons it wasn't very straightforward to say which transaction was what. I chatted with @adrianleb a lot and he was an amazing help. He explained the idea of signatures to me (the start of the data variable) and how they stand for functions used, for example if the data starts with 0x40c10f19 that means that mint(address,uint256) was used. But we discovered that each big platform was using their own flavor of those functions. Adrian therefore gathered the main addresses of the biggest NFT platforms and the biggest NFT collections (punks, kitties, etc.). I could then compare the to address variable of each transaction to that list and say if something related to NFT took place. It's not perfect, it's not complete, but it hopefully catches a lot.

In general though challenges always arise with the data items as well, because each data set has its unique quirks. Since the fundament of my visual is visualizing transactions, specifically by their value, well, what about blocks without transactions? What about blocks where all transactions had 0 ETH? I generally try and think of how I want to approach those quirks once I run into them (some I can predict will happen beforehand, but more often I find them during the creation process).
How did you find BlockArt, what attracted you to stay, and what about it makes you most excited?
I know for sure that it was Twitter, I came across a tweet, probably retweeted by someone I follow that showed a new Style from BlockArt that I really liked. I can't quite remember if that was Hapori or showing an Ether Marble. I started following the BlockArt account, but I was busy with other projects so didn't look into it further.
Some time later @adrianleb reached out to me on Twitter, saying how the data art angle that I use in my works would be a great fit with BlockArt. That intrigued me and we had a casual chat. When he fully explained how you'd have access to all the data from a single ETH block to make your visual with I was basically sold. I hadn't come across a place where I could create a generative algorithm to use as an NFT that let me use data!
Having joined a few NFT related Discords across the past months I noticed how much I liked the vibe from the BlockArt Discord, especially compared to some others. How it was really about the art, how excited people were with their mints, the extensive feedback that people are willing to give, and the idea of "block hunting". It's still the data aspect that makes me most excited, but while working on my project I've really come to enjoy the BlockArt community as well 😁
I read through your entire dataviz journey, you really have poured your heart and efforts into your passion. What advice do you have for other creative coders?
O my, well, it's not groundbreaking, but my main advice is always two-fold: create + show the world. Create lots and lots of personal projects. You'll learn new skills with each project that you might not even be aware of, which you can apply on the next project. This then leads to the second part; show others. Create a portfolio, share the results on social media, let others see the things you're proud of. You don't have to start out with your first piece rivaling a Tyler Hobbs. But if you feel even remotely proud of it, or if you just had fun making it, share it! I know it can be hard, but just share it. This has been a great way for me to become a part of communities; dataviz and genart alike 😄
If it's specifically advice on how to become better at data visualization, I've actually written a page with every ounce of advice that I could think of.
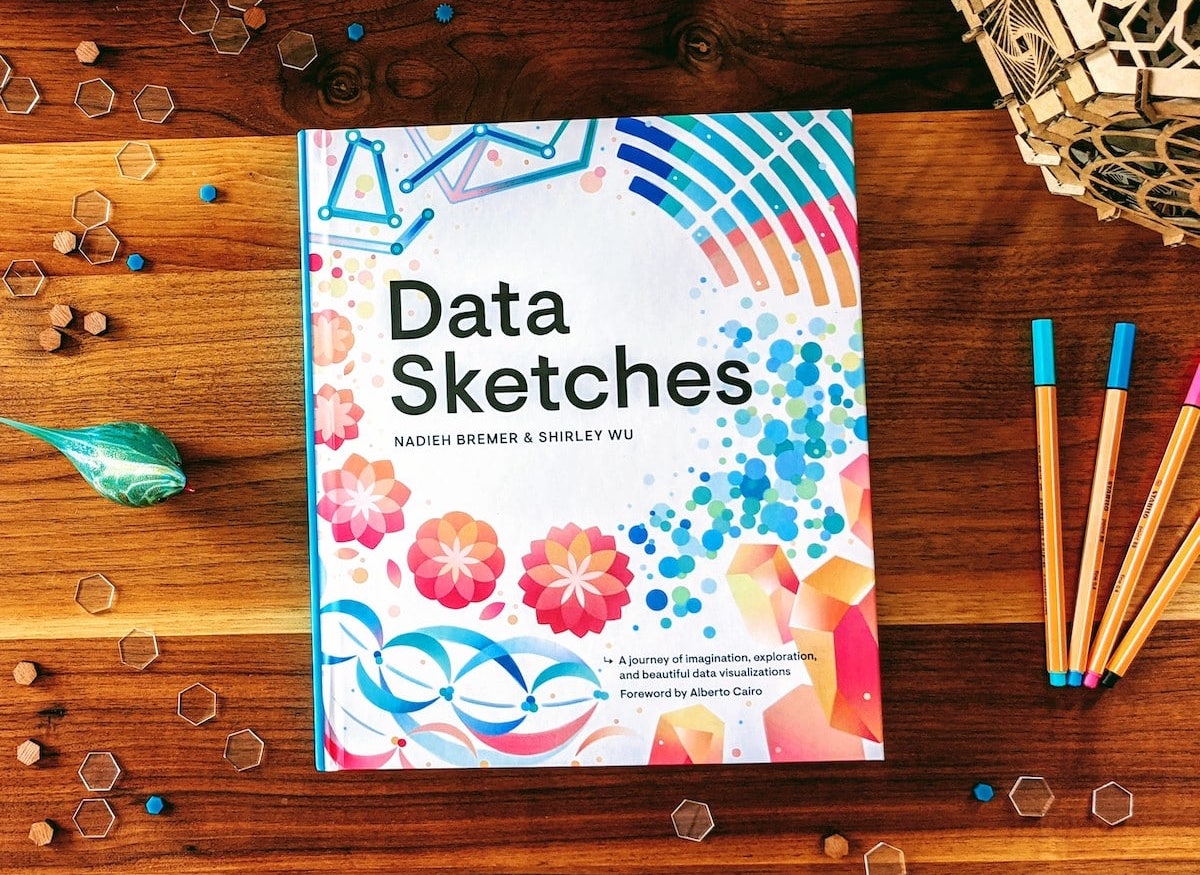
You mentioned a lot of learning both technical and creative came from your "Data Sketches," project! I'm curious, what are some of those major learned lessons?
Yeah, Data Sketches was a year+ long collaboration I did with Shirley Wu where we ended up making 12 big dataviz / data art projects each and writing about the whole creation process per project.
The biggest thing I learned was that this creative type of data visualization was the type of work I wanted to do. No more dashboards! After working on a few of these projects I took the plunge and quit my job to become a freelancer. Still the best career choice I've made so far!
Another major lesson is that it's best to make personal projects about data topics that truly interest you. Not going for the dry statistical datasets that basically every government has nicely prepared. Instead, work from the topic, from the idea, and you'll be amazed at where you can find data about it. But be open minded about it. It will likely need a lot some manual work.
For example, I found a dataset about all of the words spoken by the characters of the Lord of the Rings (in all 3 extended editions at that), a family tree of 3000 people connected to European royal families going back more than a millenia, lists of all the fights that occured in Dragonball Z on a fan Wiki, titles of major fantasy books by scraping the best-selling fantasy authors from Amazon and then gathering info about their books with the Goodreads API.
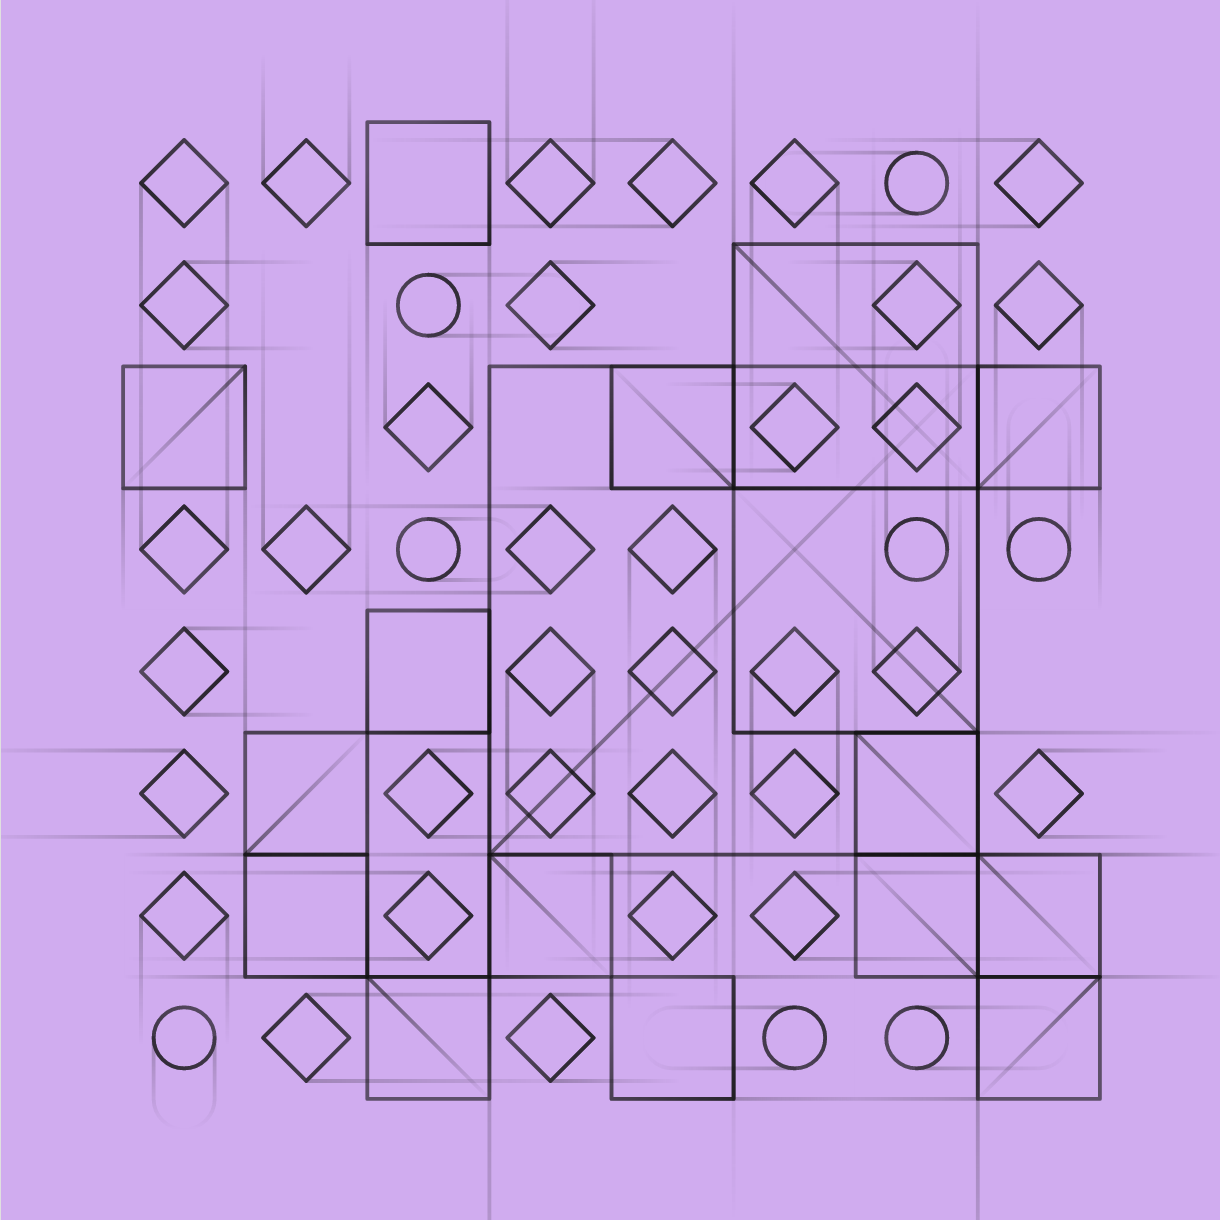
Finally, try and sketch out the ideas you have on plain paper. Don't go straight from a vague image in your head to the computer, there's bound to be some logical thinking errors that will cost you valuable time down the road. If you can't make your idea work logically when drawn on paper, it's not going to work on a computer as well.
How might you answer if someone asked you to create a dashboard these days? ;)
Hahahaha! Ok, just to have said it, but I don't think there's anything wrong with dashboards. Great dashboards can mean all the difference for people having to make important decisions. However, I personally don't like making them. I've made quite a lot, and they just don't let me be creative. So these days I will politely reply that I don't focus on anything that comes close to being a dashboard or dataviz tool, but instead work on the more creative side of data visualization 😉
What was it like for you to take the leap into freelancing full time at the time? Was the decision easy?
Being a risk-averse person, and the thought of not knowing that your paycheck will come in at the end of the month, taking the step to become a freelancer was scary as heck. However, while working on "Data Sketches" I noticed how much I loved working on that type of creative data visualization. In October of 2016 Shirley and I got the question if we perhaps wanted to collaborate with Google News Lab and have one of our remaining topics be about an aspect of Google's data.
Shirley was already a freelancer and since I didn't want to say "no" to Google, I really thought about what I wanted, looked at my financial savings (how many months could I bridge without income), and talked it over with my partner. In the end it was clear that there wasn't going to a better moment to take this plunge.
What is the best way for people to engage or follow you?
I'm most active on Twitter as @NadiehBremer but I also have an Instagram account, also under @NadiehBremer. You're able to see all of my work on my website VisualCinnamon.com (there's a newsletter sign-up at the bottom if you want to stay up-to-date about my new works about 2 times a year).
I also make one-off and small (3-to-5-ish) collections as NFTs, you'll be able to find these (for now) on Foundation.
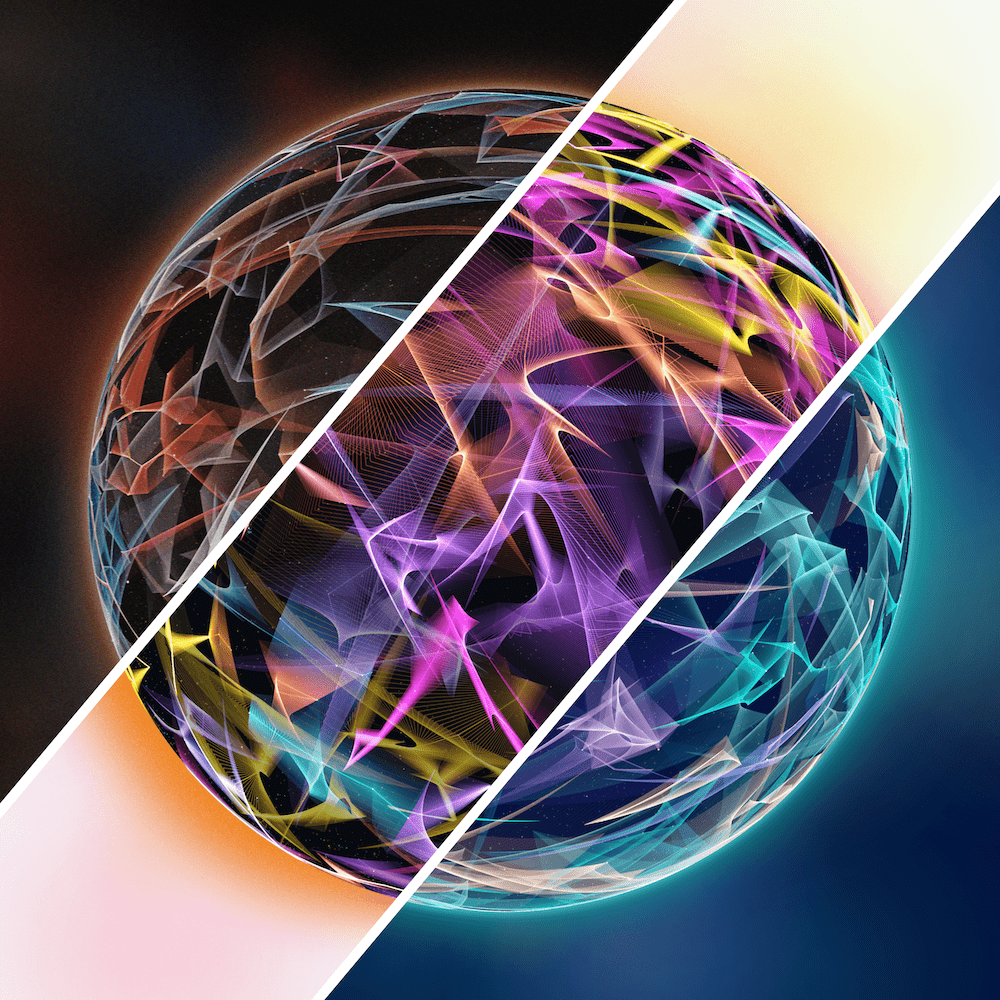
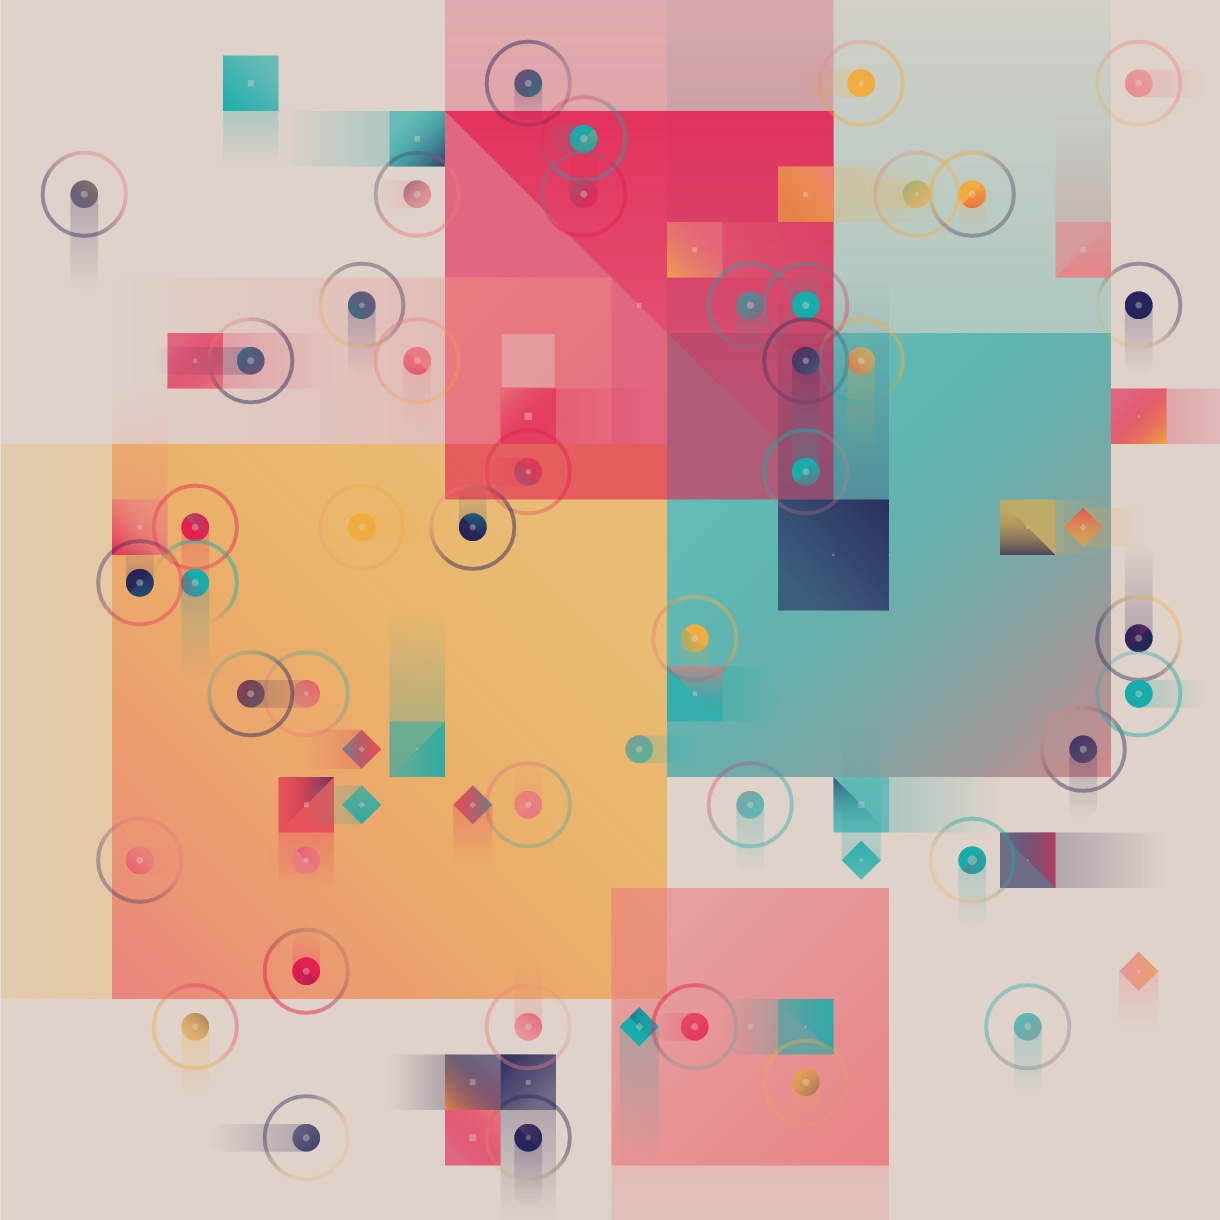
The Wanderings of Stars
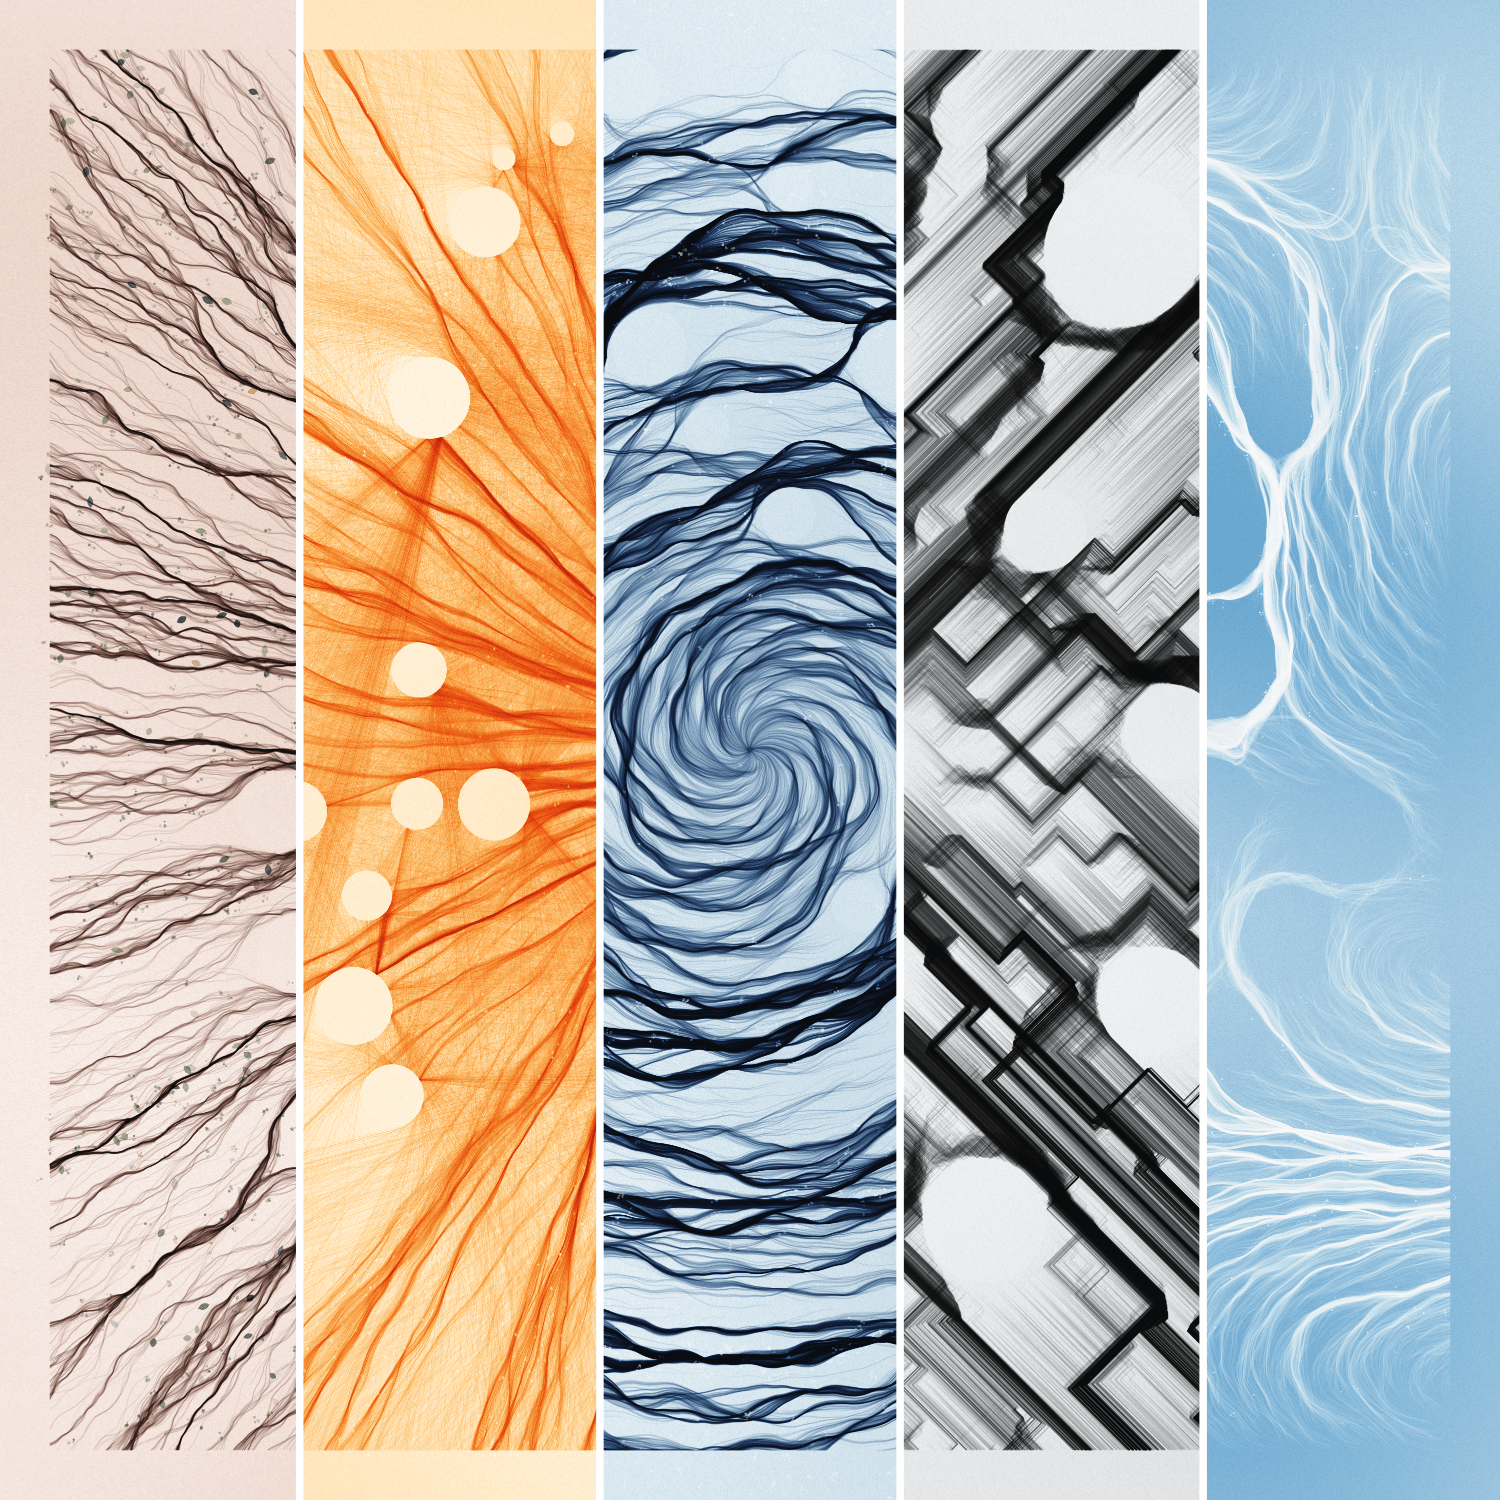
Elemental Flows
What is next for Nadieh Bremer?
You mean after my nerves have overcome doing my first big release with Wanderlust? 😆
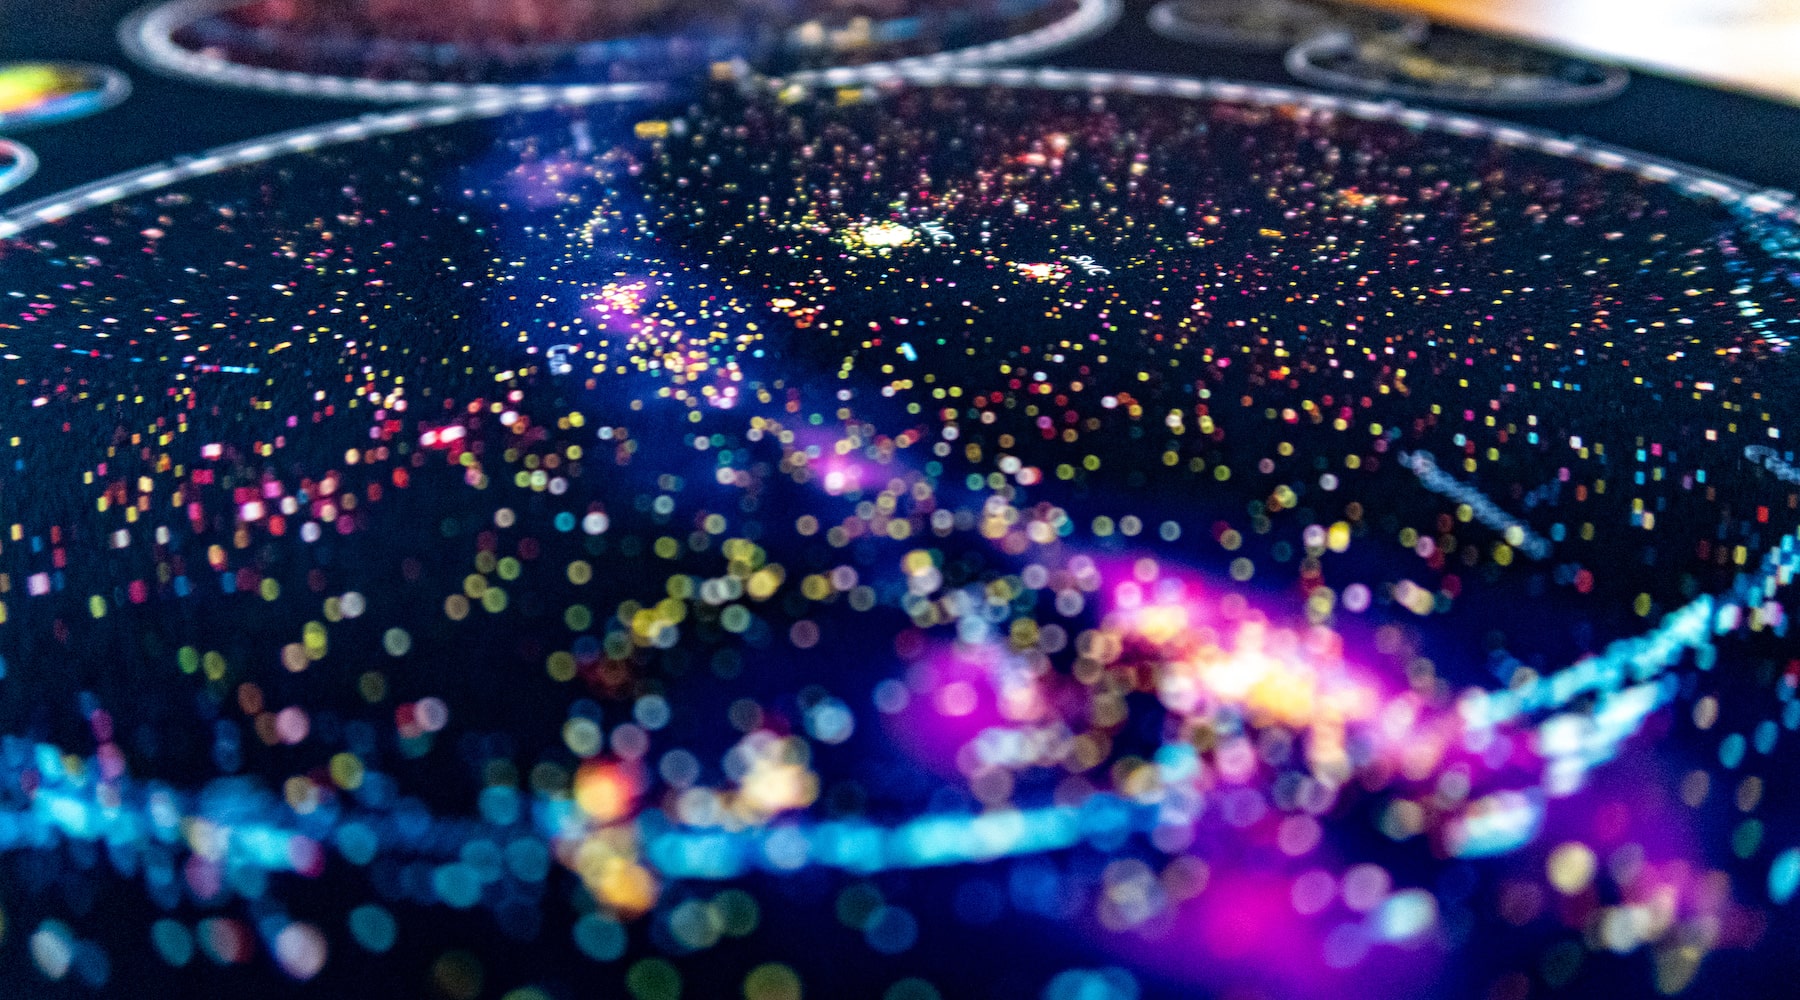
Well, I was recently contacted by someone from a collective of (deep) space photographers who are selling their mindblowingly amazing photos of outer space as NFTs. He proposed to do a collaboration, where I would take a photo and "have fun with it" in a way. I have some early thoughts written down on what I want to do, and I'm excited to play with it! No idea where it's going to end up, but I guess that's part of the fun 😁